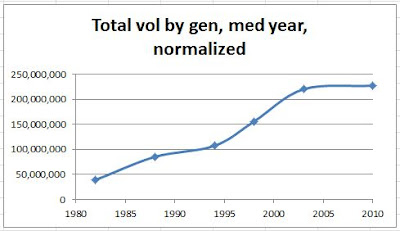
Console Volumes over time
Martin Hollis tweeted a link to this very nice graph comparing the console "Generations" and their total unit volumes:
It's a nice graph, despite the chronological order being right to left.
It's a rough swag to group by generation as it is, since launch dates and end-of-life dates have only some alignment. Since some liberties were already taken, and I was curious, I did two things:
- Aligned the generations by date, picking a rough data for "mid life cycle"
- Normalized to 2010 numbers for population size. I used the sum of US, Japan, UK, France, Germany, as my proxy for "first world", as that's where most consoles are sold anyhow.
The resultant graph looks like this (going left to right with time)
Anyhow, food for thought.

3 comments:
I think the most telling thing of all is that a rough estimate of TOTAL sales for the last 30+ years is just around 1 Billion. Whereas the number of "Smartphone" sales PER YEAR will likely exceed that in the not-too-distant future (e.g. http://articles.businessinsider.com/2012-02-29/tech/31109577_1_smartphones-pc-sales-internet)
I had to refresh the captcha piece at least 6 times to find something I felt I could understand enough to be able to type in order to submit this comment!
jimmy choo shoes
49ers jerseys
pandora jewelry outlet
coach factory outlet online
air max 90
dansko sale
ed hardy uk
red bottom shoes for women
mlb jerseys
coach outlet online
20170614yuanyuan
north face jackets
adidas nmd runner
canada goose jackets
timberland outlet store
nike air max 2018
ray ban glasses
ralph lauren
moncler coats
toms shoes
cheap ugg boots
mt1221
Post a Comment