Dataviz musings
Short version of this blog post:
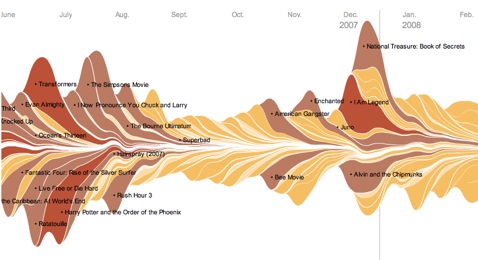
This is a pretty cool little data visualization on box office receipts over time. Not very useful, but cool and fun to play with.
Slightly-less-short version of this post:
It sure would be cool if we had a version of the above data visualization that was interactive (more than scrolling), say like this, and that we had it for, say, game releases & sales data over time. Oh, and for like 10 years worth of data. Hmmm. Yeah, that'd be nice.
Lengthier version of this post:
I've been wrestling with some gnarly data visualization stuff at work, trying to get some trends to pop out of complex data sets in a simplified and obvious way. It's been a pain, I've spent a bunch of time looking at different chart models like circular histograms, donut charts, radar charts, etc. None of them really does what I need, so I'll just have to resort to building something myself.
While looking at all these things though, I've been thinking a lot about how dramatically the impression the visualization can sway depending on the choice of how it's visualized. Also, on how much better the data can 'pop' when its interactive. The example above lets you scroll back and forth through time (do so and the holiday/summer blockbuster cyclical nature of the box office is plainly obvious). Also, mousing over individual movies lets you see their rate of decay and staying power (check out films like Forest gump or Sixth sense, for example).
I'd like more tools though. Zoom. Band-pass filter. For example, is there a macro level cycle at play? (like lemmings!). Or did the advent of VCR, DVD, Cable, Blue-ray have any material impact?
Of course, I care about having all this for games more than movies. There are a couple things holding us back.
The biggest is a lack of decent data. As I'd previously mentioned, we don't have The Numbers for games. We have NPD data which is NA only, lousy for PC, decreasing in relevance as DLC, subscriptions and digital distribution gain in relevance vs retail. Other research groups publish numbers but it's all pretty fragmented and worse, its expensive.
The opacity of the online services sales figures also doesn't make things any easier. VGChartz does a half decent job deciphering numbers but that's only an artifact of how leaderboards work consistently across XBLA titles. Good luck doing the same with Steam and it's brethren.
The second thing we need are better tools to parse the data, especially if it's coming from numerous asymetrical sources. Things like Motioncharts (Google docs' integration of Gapminder)can help but then someone needs to go mash that data in there in a useful way. The good news on this front is that there are a bunch of dataviz apps that seem to be waterfalling down from nichy segments of the market to general business usage or integrated into the cloud apps (motioncharts being an example of exactly this).
The third thing we need is for someone to build gaming's equivalent of The Numbers. If this stuff exists in a few spreadsheets buried within MS or EA, it's not of nearly the use it can be when the whole net can dig in and start doing some archeology on the data.
Anyhow, I've got a big spreadsheet to get back to...

No comments:
Post a Comment